ONLINE Dan Fulleton Farm Equipment Retirement Auction
THIS WILL BE AN ONLINE AUCTION Visit bakerauction.com for full sale list and information Auction Soft Close: Mon., March 3rd, 2025 @ 12:00pm MT Location: 3550 Fulleton Rd. Vale, OR […]
Published 10:15 am Friday, February 2, 2024
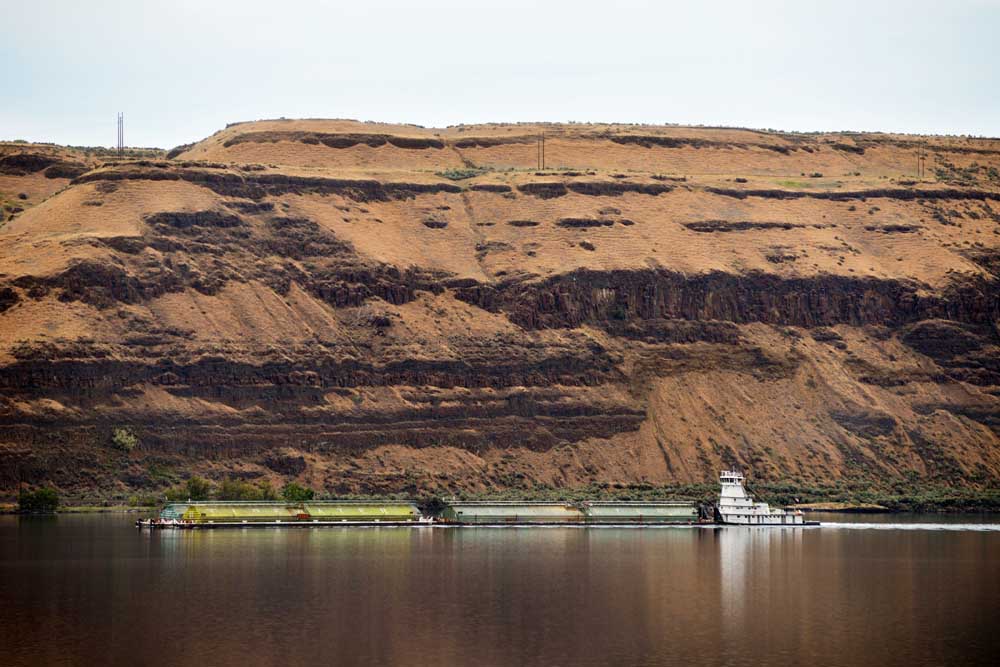
A new USDA-funded report found the Columbia and Snake River transportation system contributes about $346 million to the region’s economy each year.
“It’s a critical corridor,” principal investigator Eric Jessup, assistant professor in Washington State University’s School of Economic Sciences, told the Capital Press.
The study, from USDA’s transportation services division, examined barging grain, fertilizer, petroleum, forest products and sand and gravel aggregates on the rivers. They represent about 83% of the cargo on the Columbia River and 88% of the cargo on the Snake River.
Researchers also explored three potential scenarios for maintaining the locks and dams on the rivers:
• All maintenance projects are completed, improving river transportation efficiency. This would reduce transportation costs 6% and add $56 million per year to the regional economy.
• Planned maintenance projects are postponed. This would increase expenses 6% and cost $21 million per year to the regional economy.
• Maintenance is neglected. This would raise expenses 12%, costing the region’s economy $36 million per year.
The total economic impacts measured for each scenario include the direct impacts of increased or decreased barge transportation costs on shippers, and the indirect impacts of changes in spending, production, job creation and other factors on the regional economy, according to the study.
The researchers did not study removing the dams. It was not included in USDA’s request for proposals, Jessup said.
“For things like wheat, fuel and fertilizer, transportation is a big component of their delivered cost or delivered value,” Jessup said. “If you want to look at the possibility of removing different aspects of that navigation system, you’re going to impact those markets substantially.”
“Our systems here are in pretty good shape,” Jessup said, noting the systems are well maintained. “It’s a very efficient system.”
Jessup said the Columbia-Snake river system, most of which was built in the 1970s, is newer than the Mississippi, Ohio and Illinois river systems, which were built from the 1930s to 1950s.
“They’ve actually been maintained better and actually do not have quite as severe challenges, because the water that comes down predominately is controlled,” he said.
The Midwest river systems are more impacted by weather and drought, so fluctuations in water levels there have great impact on the locks and dams, he said.
‘Marvel of infrastructure’The Pacific Northwest Waterways Association and other agricultural stakeholders provided data for the study, said Anthony Pena, government relations manager for the association.
“It demonstrates and highlights ultimately that the Snake River and Columbia-Snake River as a whole are truly a marvel of infrastructure and really important to not only the region but the country in terms of agriculture and shipping,” Pena said.
Pena hopes to eventually see a study examining the value of the river system nationwide, beyond the Pacific Northwest.
The study only examined the economic impact of navigation, moving freight on the river system.
It’s “one small piece of the puzzle,” Jessup said. Others are electricity generation, recreation and irrigation.
Jessup believes what’s needed is a full study that weaves together all of the components.
It’s unclear whether such an approach would come from Washington Gov. Jay Inslee or elsewhere, he added.
“If in the future they want to evaluate tradeoffs associated with potentially removing some of those locks or dams, they have to take into consideration all of these interactions, not just one at a time,” he said. “If you’re really wanting to evaluate removing those things, it’s going to impact all of those different facets of the system, so you need to look at them all holistically.”
• Baseline transportation costs for grain total nearly $140 million per year. Of this, barge transportation costs total $54 million, about 38.2% of total grain transportation costs.
• Baseline transportation costs for petroleum total $265 million per year. Of this, barge transportation costs total nearly $10 miilion, about 3.7% of total petroleum transportation costs.
• Baseline transportation costs for fertilizer total $4 million per year. Of this, barge transportation costs total $481,000 per year, about 10.9% of total fertilizer transportation costs.
• Baseline barge transportation costs for sand and gravel are more than $12 million per year. Total baseline transportation costs for sand and gravel are unknown.
• Baseline barge transportation costs for forest products are more than $10 million per year. Total baseline transportation costs for forest products are unknown.