ONLINE Dan Fulleton Farm Equipment Retirement Auction
THIS WILL BE AN ONLINE AUCTION Visit bakerauction.com for full sale list and information Auction Soft Close: Mon., March 3rd, 2025 @ 12:00pm MT Location: 3550 Fulleton Rd. Vale, OR […]
Published 8:30 am Tuesday, November 28, 2023
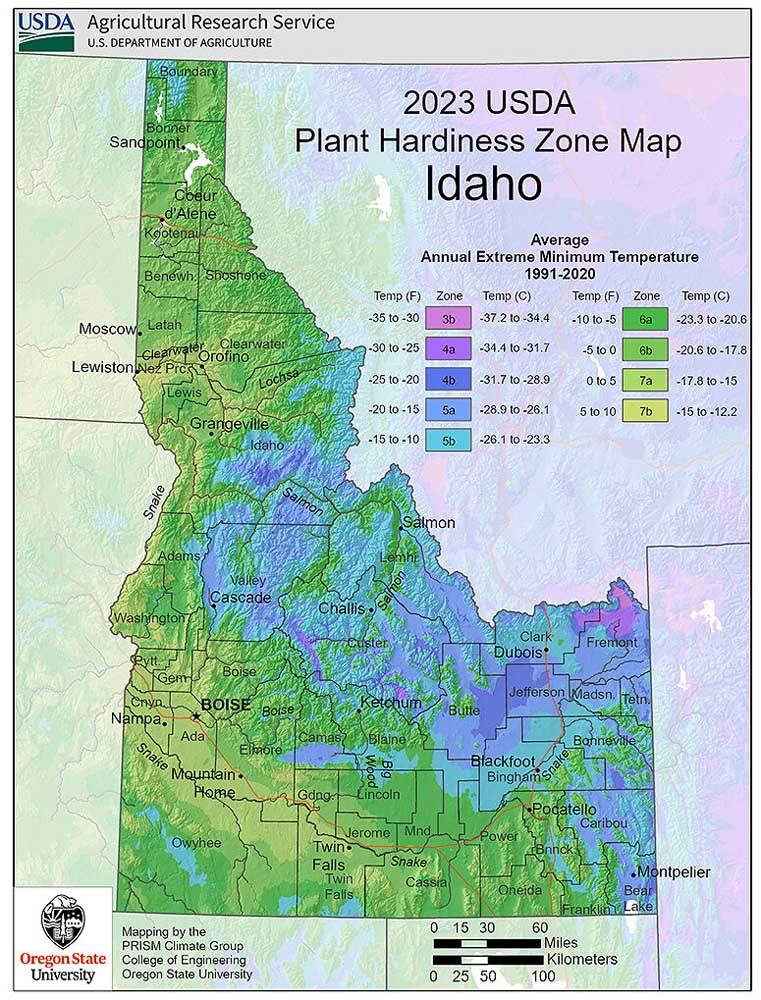
The USDA’s new Plant Hardiness Zone Map shows temperatures about 2.5 degrees higher in the United States than the previous version released in 2012.
The map is used to determine what plants will likely survive the coldest annual weather at locations.
The Plant Hardiness Zone Map was jointly developed by the USDA Agricultural Research Service and Oregon State University’s PRISM Climate Group, which is part of the OSU College of Engineering.
New data resulted in about half the country shifting to a warmer 5-degree half zone, said Christopher Daly, PRISM Climate Group director and the map’s lead author.
“The central plains and Midwest generally warmed the most, with the southwestern U.S. warming very little,” Daly said.
Climate change is a factor in the higher temperatures, but more weather stations and improved technology also showed localized changes, Daly added.
He said development, with urban heat islands, can play an impact as well.
This year’s map includes data from 13,400 weather stations, as opposed to the nearly 8,000 used for the 2012 edition.
The map is based on 30-year averages for the lowest annual winter temperatures at locations, and the latest version uses data from 1991 to 2020. The 2012 map was based on averages from 1976 to 2005.
The 1990 map showed a similar temperature change but used only 13 years of data, so it may not be as reliable, Daly said.
Official plant hardiness maps have been around in some form for about 100 years, but mapping techniques have improved, he said.
Fred Weisensee, co-owner of Dancing Oaks Nursery & Gardens in Monmouth, Ore., said the new zone map confirms what people already know. He grew up in the Willamette Valley and said there’s been a dramatic change in temperatures over the decades.
“We’re seeing plants survive year after year that we would have lost in the past. Things that ordinarily did not thrive or survive are doing amazing,” he said.
Grevillea shrubs from Australia and flowering maples are just two examples, Weisensee said.
“Our climate is becoming more similar to southern Oregon and northern California. … Plants that have been here for millennia are now showing signs of stress,” Weisensee added.
In the 1990 zone map, much of the central and lower Willamette Valley was in the 8a category, with a yearly lowest temperature averaging 10-15 degrees. Long sections of the Oregon Coast also were in that zone.
The Willamette Valley now is firmly in 8b (with lows of 15-20 degrees) and many parts of the Portland area are in 9a (20-25 degrees).
The Oregon Coast is mostly 9a now, with growing pockets of 9b (25-30 degrees). The southern Oregon Coast even has a small 10a area (30-35 degrees).
Sean Hogan, owner of Cistus Design Nursery on Sauvie Island near Portland, said the new map has more detail to capture microclimates, but it should be thought of as a starting point.
“It’s only data. We have to fill in the rest,” Hogan said.
Residents should seek out more information, including by talking to neighbors.
Cold frequency, length of time below freezing and wind also are factors that can contribute to plant success. Maps that show heat and summertime low temperatures also can be important for gardeners and growers, Hogan said.
He added that he drops a zone or goes even lower for trees that represent large investments, to ensure they survive the chilliest times.
The USDA Risk Management Agency uses the zone map in setting certain crop insurance standards, and scientists incorporate the plant hardiness zones into research models, such as those looking at the spread of exotic weeds and insects.
Yearly lowest temperature averages in parenthesis
Oregon
Astoria
1990 – 8b (15 to 20)
2012 – 8b (15 to 20)
2023 – 8b (15 to 20)
Bend
1990 – 6a (-10 to -5)
2012 – 6b (-5 to 0)
2023 – 6b (-5 to 0)
Medford
1990 – 8a (10 to 15)
2012 – 8a (10 to 15)
2023 – 8b (15 to 20)
Pendleton
1990 – 6a (-10 to -5)
2012 – 7a (0 to 5)
2023 – 7a (0 to 5)
Washington
Mount Vernon
1990 – 8a (10 to 15)
2012 – 8a (10 to 15)
2023 – 8b (15 to 20)
Spokane
1990 – 5b (-15 to -10)
2012 – 6b (-5 to 0)
2023 – 7a (0 to 5)
Yakima
1990 – 6b (-5 to 0)
2012 – 6b (-5 to 0)
2023 – 7a (0 to 5)
Idaho
Boise
1990 – 6a (-10 to -5)
2012 – 7a (0 to 5)
2023 – 7a (0 to 5)
Lewiston
1990 – 6b (-5 to 0)
2012 – 7b (5 to 10)
2023 – 7b (5 to 10)
Pocatello
1990 – 5b (-15 to -10)
2012 – 5b (-15 to -10)
2023 – 6a (-10 to -5)
California
Davis
1990 – 9b (25 to 30)
2012 – 9b (25 to 30)
2023 – 9b (25 to 30)
Fresno
1990 – 9b (25 to 30)
2012 – 9b (25 to 30)
2023 – 9b (25 to 30)